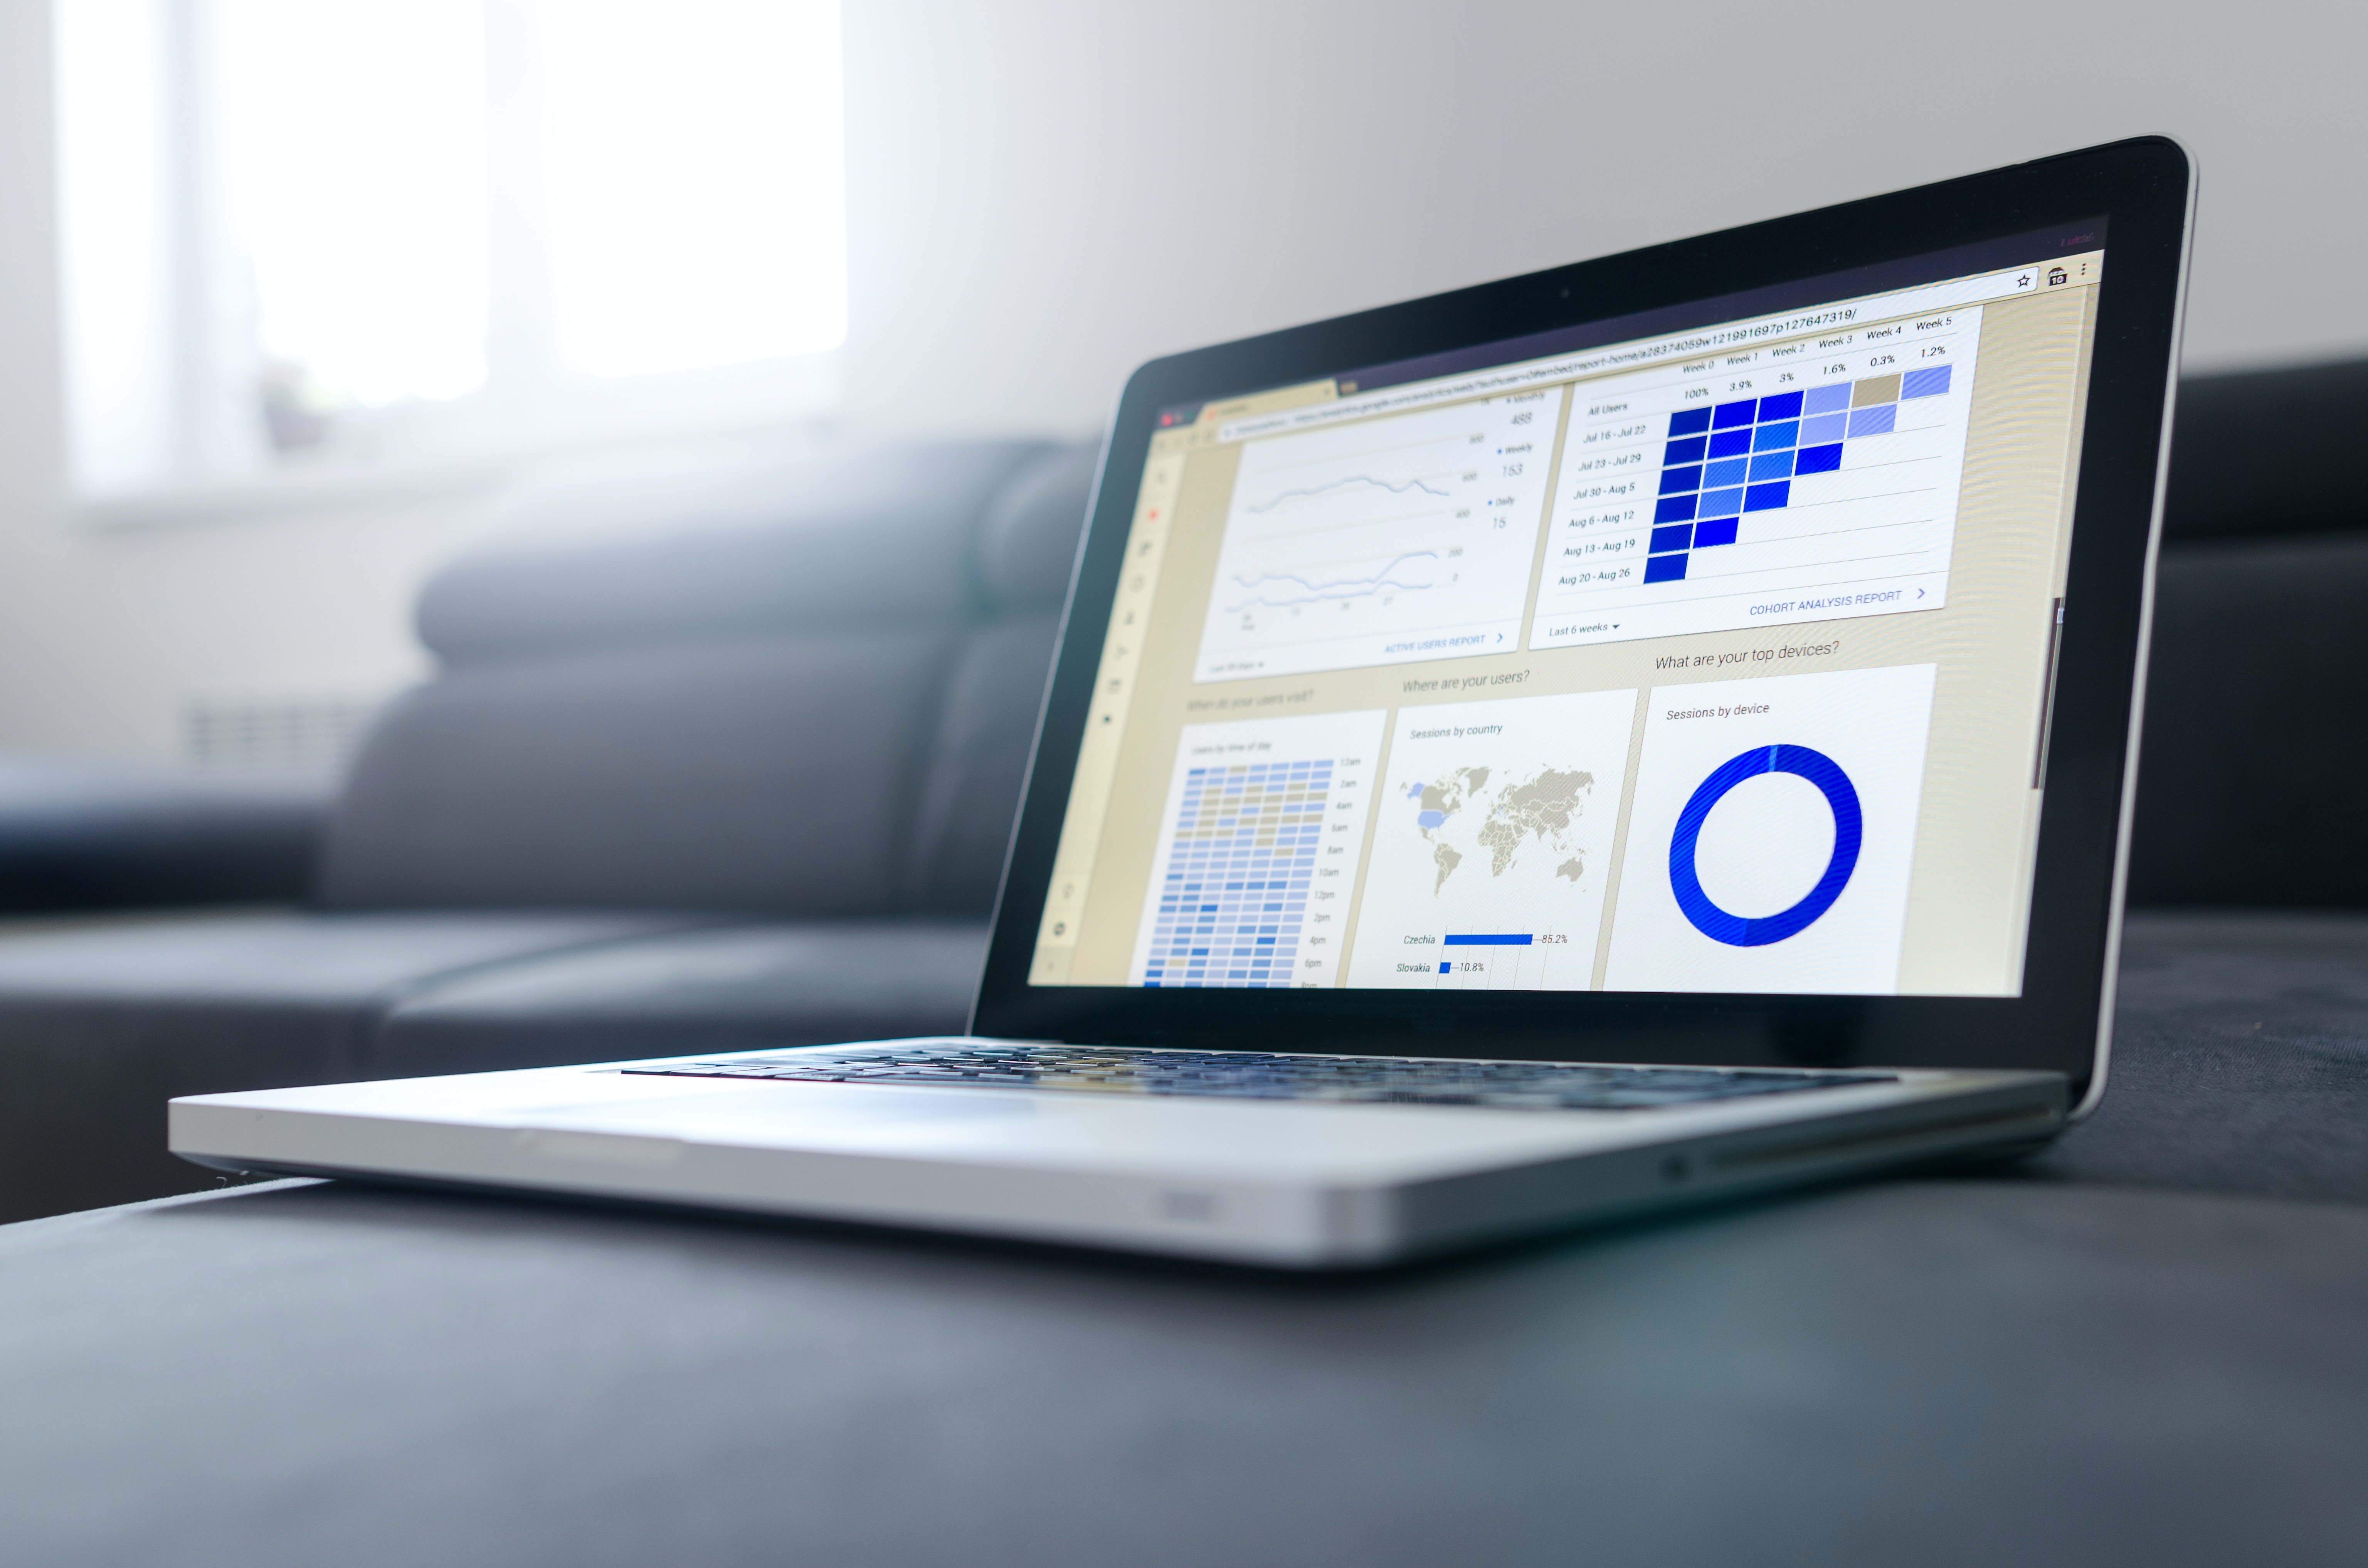
Sales analysis is an important aspect of running every successful business. Through sales analytics, you can decide which products to focus on,
where to sell and how best to reach customers. In this project, I clean and prepare sales data for analysis using SQL before loading it into Power BI for data
modeling, analysis and visualization. The client wanted to improve their internet sales reports to focus on how
much of which products they had sold and to which clients. They also wanted to monitor their employees' performance and
to compare their budget values against actual performance over time.I prepared sales, customers and products overview dashboards
and made recommendations driven by the findings for the client to make insightful business decisions.


In this project I analyse call center data for a telecommunication company to give insight into their telcom marketing operations and customer satisfaction levels. The client was looking for transparency and insight into
the data they had at the call center and wanted to have an accurate overview of long-term trends in customer and agent behaviour.
I visualize the data in Power BI to tell the story and make the important aspects clear. The dashboard I created reflects all relevant KPIs and metrics in the dataset.

Customers in the telecom industry are hard-earned and companies don't want to lose them. In this project, the Retention Manager from a telecom reached out to me
and asked if I could put together a dashboard about customer retention.They wanted to know more about their customers, visualized clearly so that it is self-explanatory
for their management. My task was to define proper KPIs, create a dashboard reflecting the KPIs, and write a report explaining my findings, while including suggestions
as to what needs to be changed.

Data Prep & Cleaning is a hard unavoidable step if you want to give your Machine Learning model the best chance to learn and perform well.
In this project I cleaned and analysed a dataset that contains vast information on adults of diverse ages and incomes.
I used matplotlib and seaborn libraries to visualize the data.

Preparing and cleaning Data is an extremely important part of the overall Machine Learning processes.
In this project I use skills in Pandas and Numpy to explore an employees dataset and perform
data cleaning and analysis to gain actionable insights for decision making.

In this project I use Power BI to analyse a hotel booking dataset to give insight to a company keen on knowing it's business performance,
the favorite destinations for clients and the top countries where guests originate from to improve their marketing
strategies and drive profits. Prepared a dashboard focusing on the company's key metrics to drive decision making.

The sales funnel provides a useful framework through which you can analyze your business and identify areas for improvement.
It's a useful model for visualizing the customer journey from initial awareness all the way through conversion.
In this capstone project from my 'Learn SQL' course on Codecademy, I used SQL to analyse Warby Parker's usage funnel to
gain insight into the number of clients that make it to the next stage of the funnel.


